thankQ Help
1.Edit the Pivot Report created above
2.Drag the bottom line of the Group Header down to fit the Chart
3.Drag the Chart item from the Tool Box underneath the Pivot table
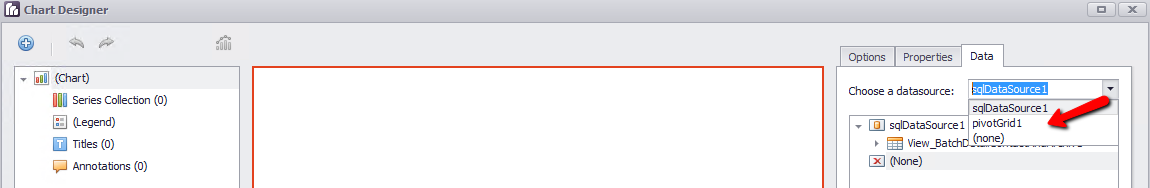
4.Click the drop down beside Choose a datasource under the Data tab
5.Select the pivotGrid1
6.Exit the Chart Designer and Save
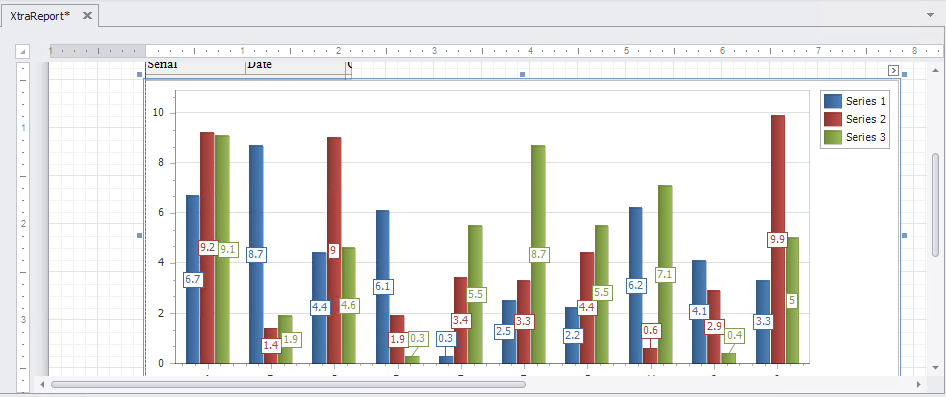
7.Edit the Group Header size by dragging the bottom line down and make the Chart larger
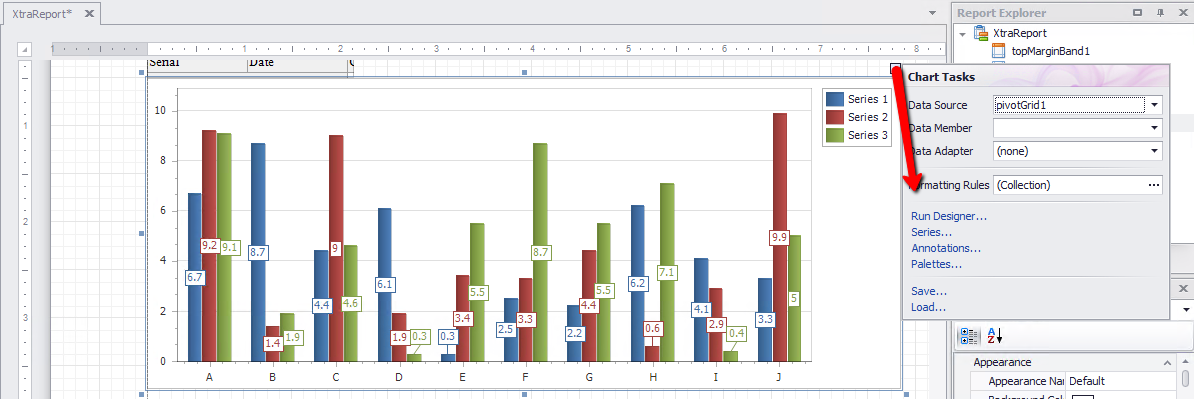
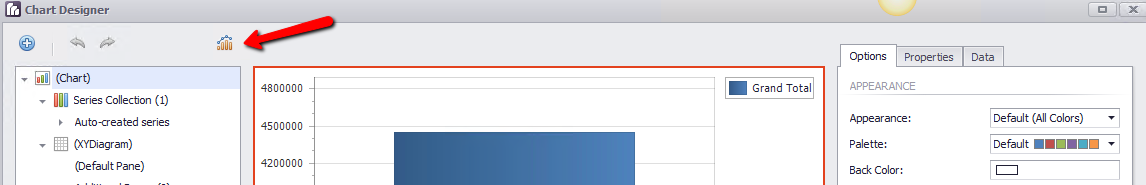
8.Click the smart tag on the Chart to open the properties
9.Click Run Designer
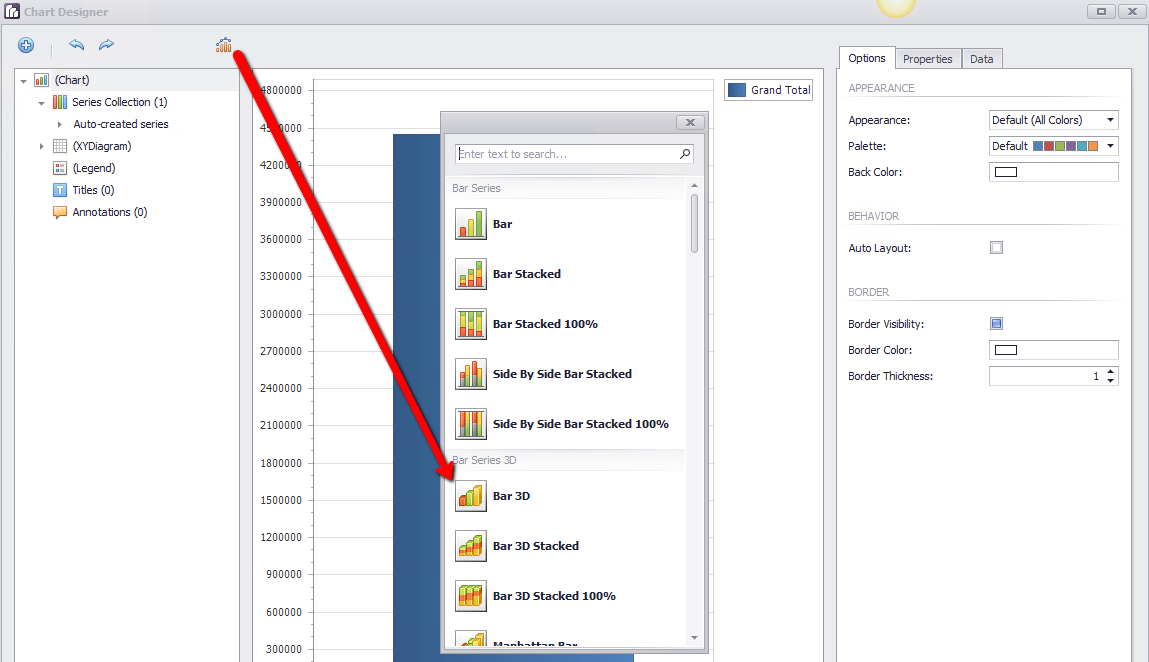
10.Change the Chart type using the chart button at the top of the form
11.Select the type of chart from the list displayed, Bar 3D
12.Exit Chart Designer and Save the changes
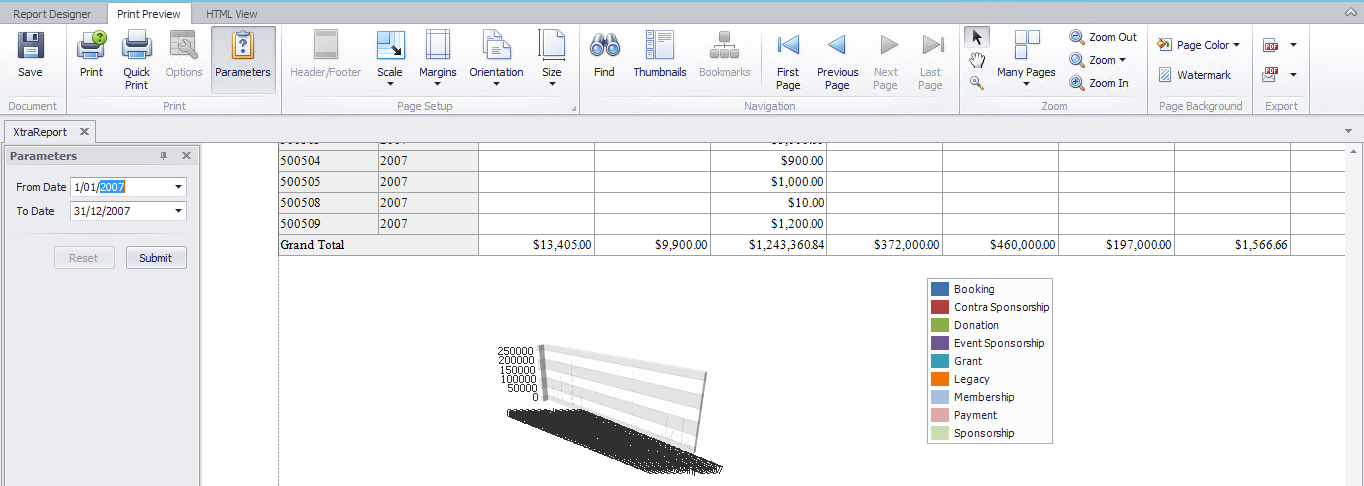
13.Preview the report entering a date range
14.Change the paper size and/or margins to fit
15.Click the Report Designer tab
16.Edit the Chart Designer and select the Bar Chart