thankQ Help
This pane displays the buttons that are used to manage the fields collection.
Button |
Description |
|
The Show/Hide Field List button displays or hides the Field List containing the available data source fields. |
|
The Search Boxes button displays or hides search panels in the Field List and PivotGrid Fields panes. |
|
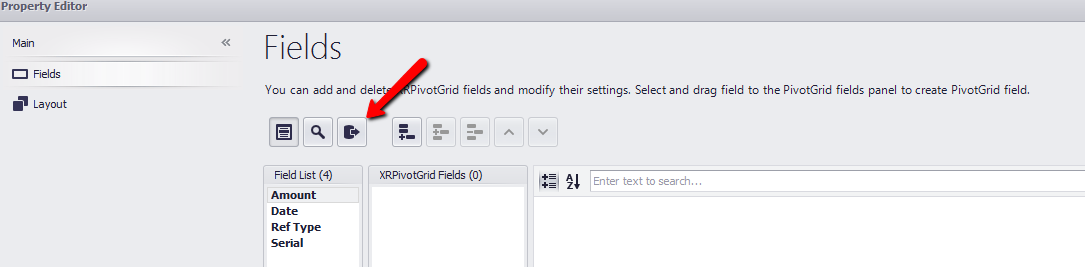
The Retrieve Fields button creates fields for all fields in the bound data source. Any existing fields are deleted first. New fields are created in the same order as the bound fields appear in the data source. |
|
The Add Field button creates a new field and adds it to the collection. |
|
The Insert Field button creates a new field and adds it at the currently selected position. |
|
The Remove Field button removes the selected field from the collection. Hold down the SHIFT or CTRL key while clicking field names to select and remove multiple fields. |
|
The Move Up button swaps the selected field with the previous item. |
|
The Move Down button swaps the selected field with the next item. |


1.Click Printing at bottom left
2.Change the Font to Arial
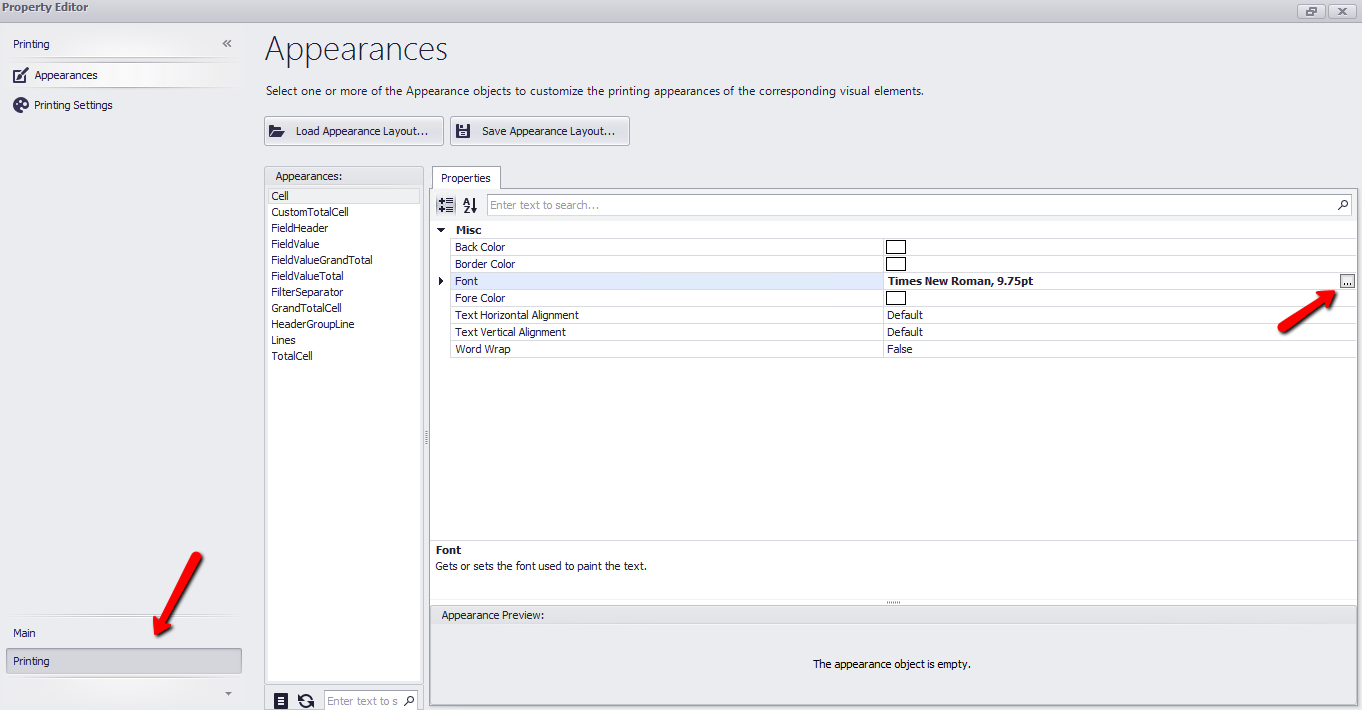
3.Click Main bottom left
4.Click the Retrieve Fields icon to add all fields to be used with the Pivot, otherwise drag the required fields into the XRPivotGrid Fields window
5.Click on Date to access it’s properties
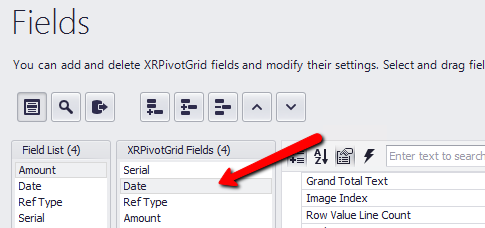
6.Click the drop down beside Grouping Interval and select Year so the total will be by calendar year

7.Click Layout to start designing

The Fields that have been selected will be displayed at the top of the form. These can be dragged into the required positions.
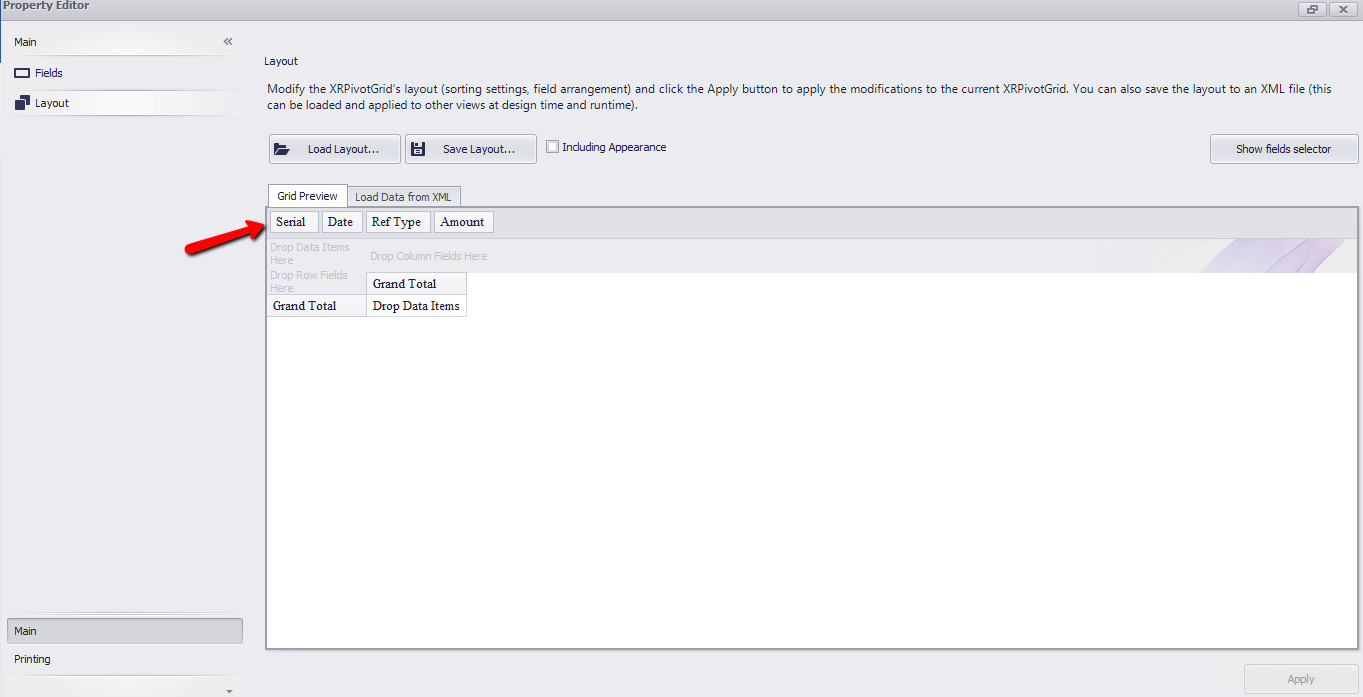
8.Drag Ref Type to Drop Column Fields Here
9.Drag Serial to Drop Row Fields Here
10.Drag Date to Drop Row Fields Here
11.Drag Amount to Drop Data Items Here

12.Click Apply bottom right and Click X to save and exit
13.Add a Date From and a Date To Paramater under the Field List window

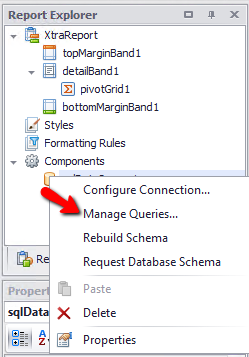
14.Right click on the sqlDataSource1 data source and select Manage Queries
15.Click the … ellipse beside View_BatchDetailContactAndArchive table

16.Click Run Query Builder
17.Click Filter on the Query Builder window
18.Add the Date filters and bind to the parameters
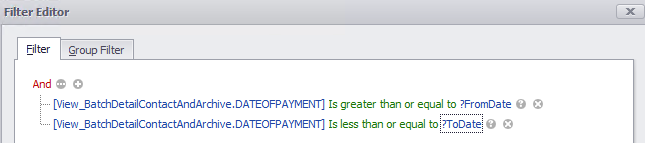
19.Click OK
20.Click OK on Query Builder
21.Click Next on Query Editor
22.Click Finish on Query Editor
23.Click OK on Manage Queries
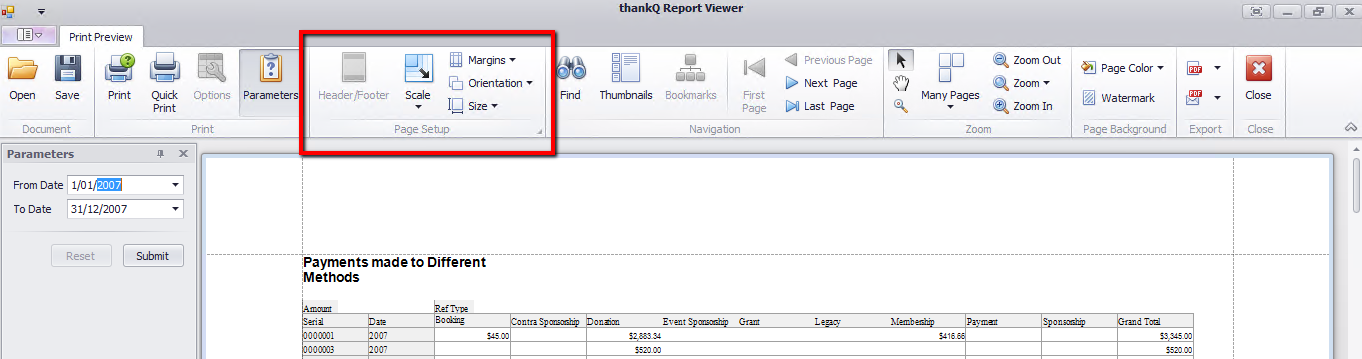
24.Click on Print Preview tab
25.Enter a Date range and click Submit

26.Click the Report Designer tab
27.Click the smart tag on the Pivot Grid and select Run Designer
28.Click on Layout
29.Drag column widths as required, click Apply and Exit

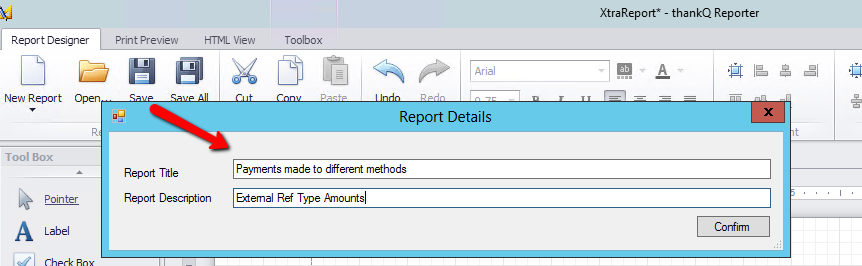
30.Click Save on the Tool Bar
31.Enter a Name and Description for the Report
32.Click Confirm
33.Click OK
34.Exit thankQ Reporter
35.Refresh the list by pressing Enter in the Report Id field
36.Click Report | Report on tool bar and run the report entering the Date parameters
37.Use the options on the tool bar to customise