thankQ Help
Pivot Grids are exceptionally good when you want multi column spreadsheets.
The following example is where we want to display the Exernal Ref Type (e.g. Donations, Events, Grants, Merchandise etc) in columns rather than rows.
1.Click Report | Report Designer under User Defined Reports

2.Click OK to Yes – Create New Report

3.Click the drop down on the New Report button and select New Report

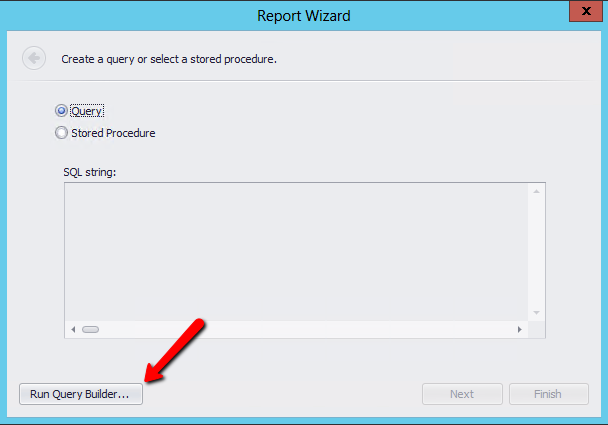
4.Click Run Query Builder on the Report Wizard window
5.Locate and double click on View_BatchDetailContactAndArchive
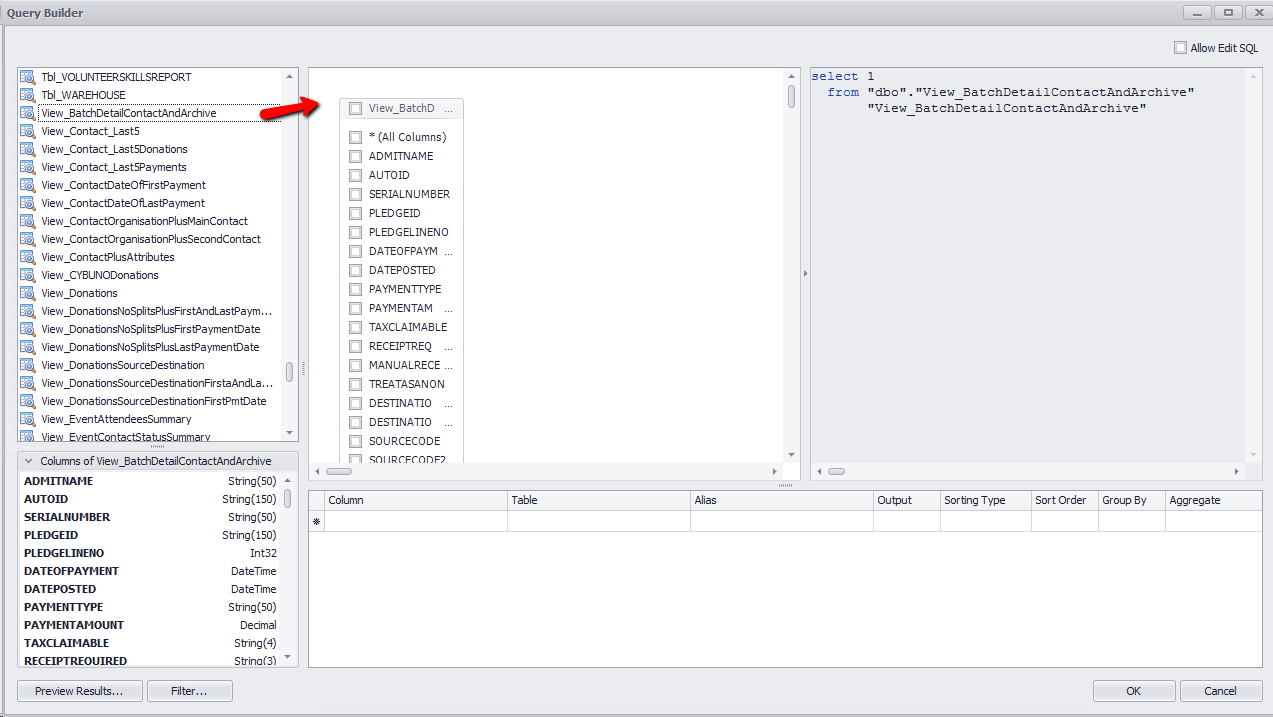
6.Tick the following fields to use on the report
Serial Number
Date of Payment
Payment Amount
External Ref Type
7.Enter Alias Names

8.Tick the Group By tick boxes and Sum the Amount
9.Click OK

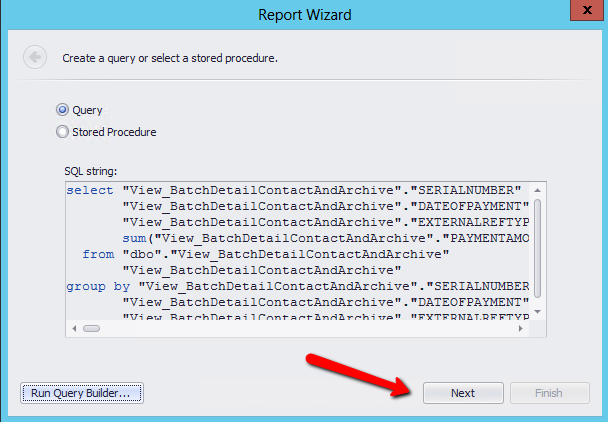
10.Click Next
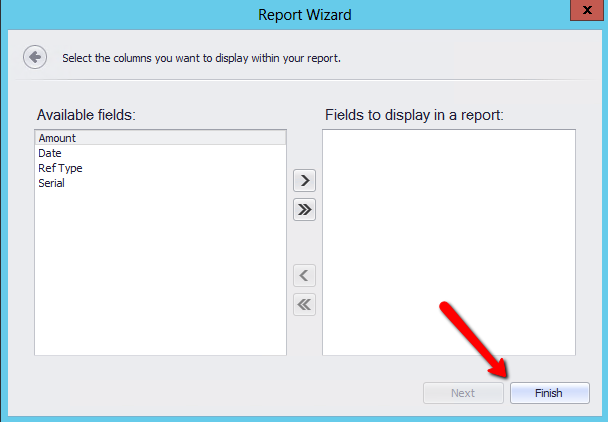
11.Click Finish
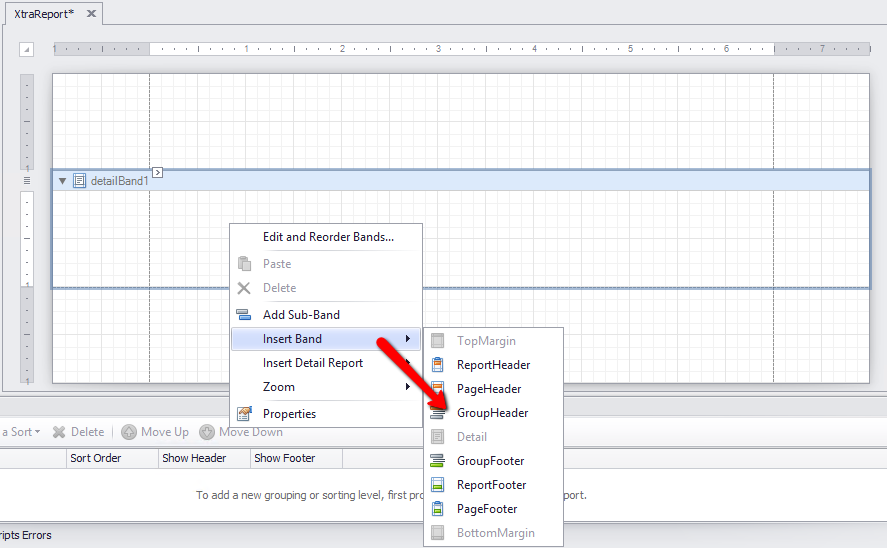
12.Right click on the report and select Insert Band
13.Select Group Header
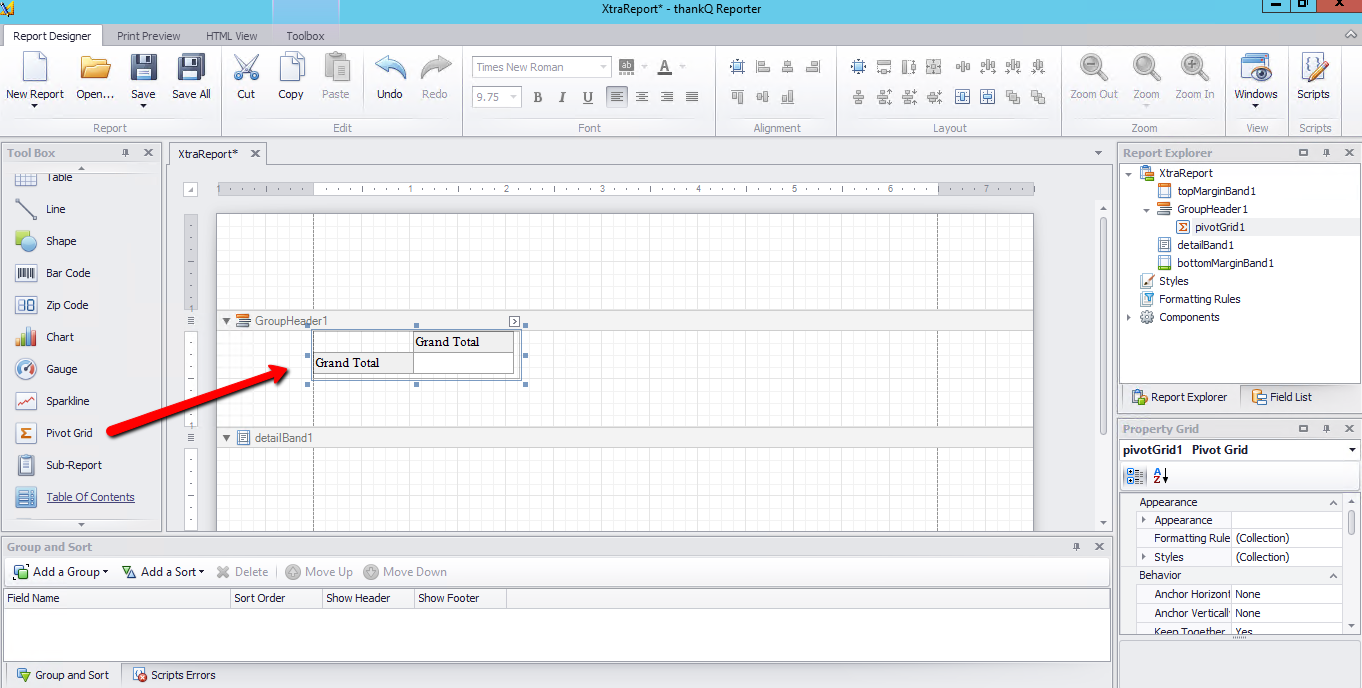
14.Drag the Pivot Grid to Group Header
15.Grab the bottom line of the Group Header and drag up to remove space
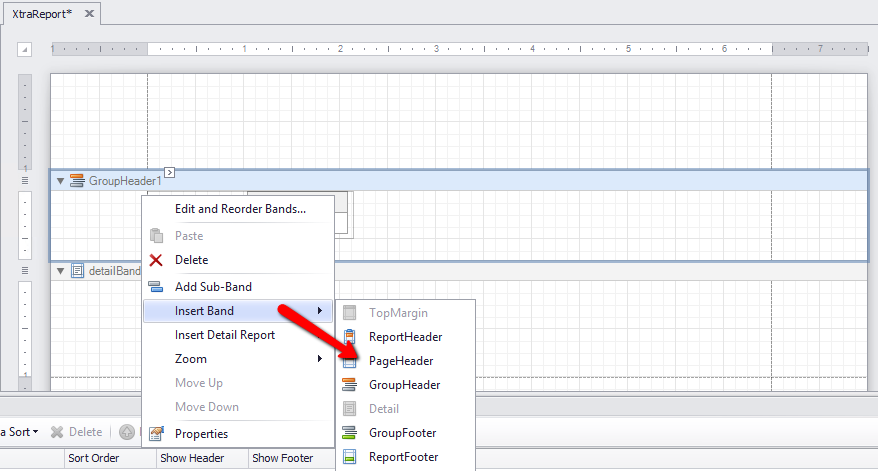
16.Right click in the XtraReport window and select Insert Band
17.Select PageHeader
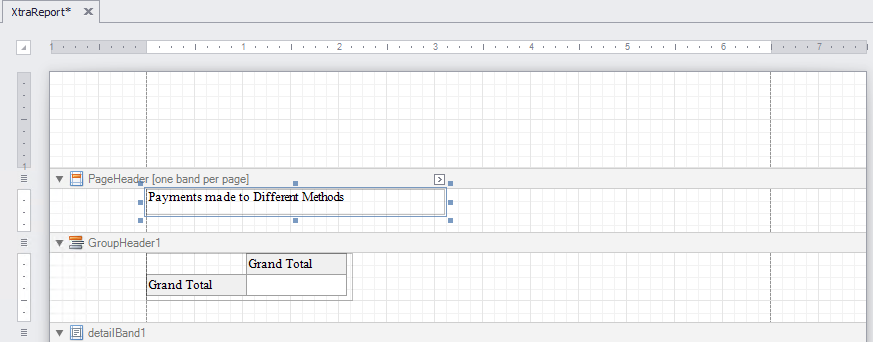
18.Drag Label from the Tool Box into the Page Header band
19.Position and enlarge as required

20.Double click into the label field and enter the name for the report
21.Grab the horizontal line at the bottom of the Page Header and move up
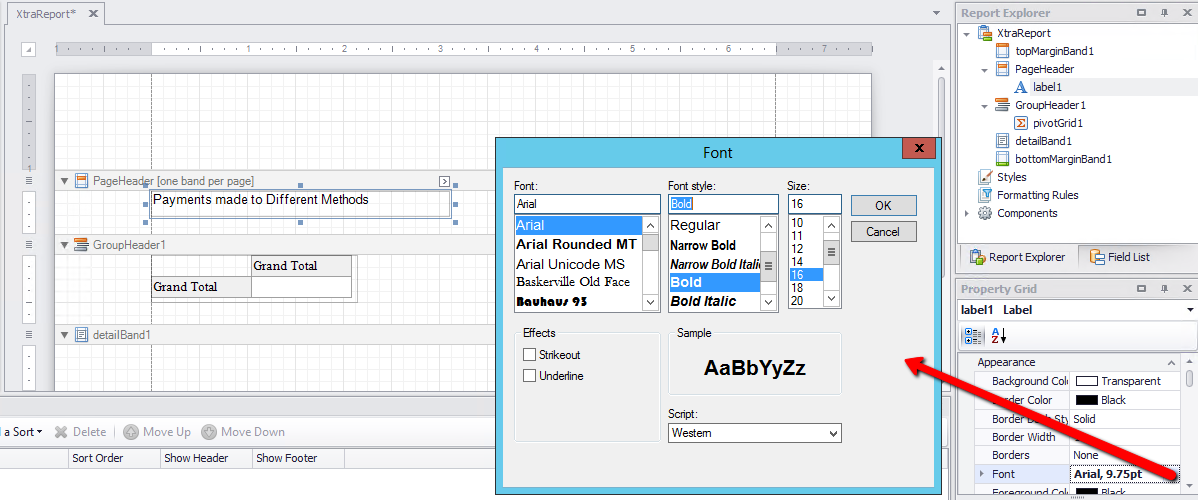
22.Change the Font and Size using the Property Grid
23.Click on XtraReport in the Report Explorer window
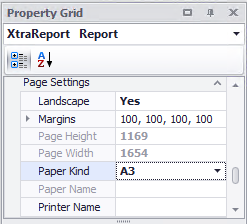
24.Scroll down and locate Page Settings and change to Landscape
25.Change the Paper Kind to A3
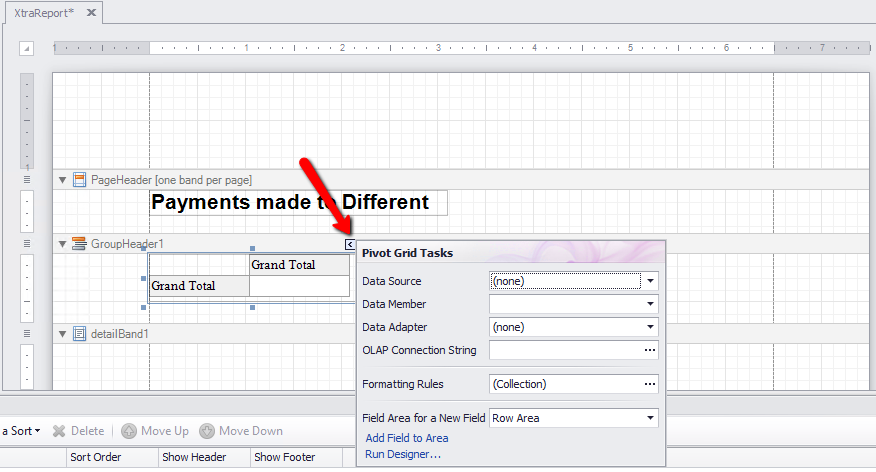
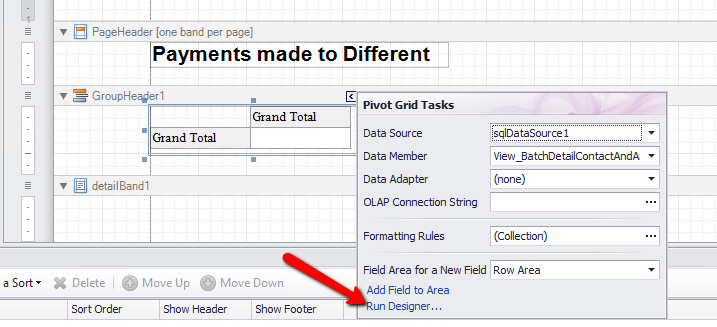
26.Click the smart tag top right of the grid
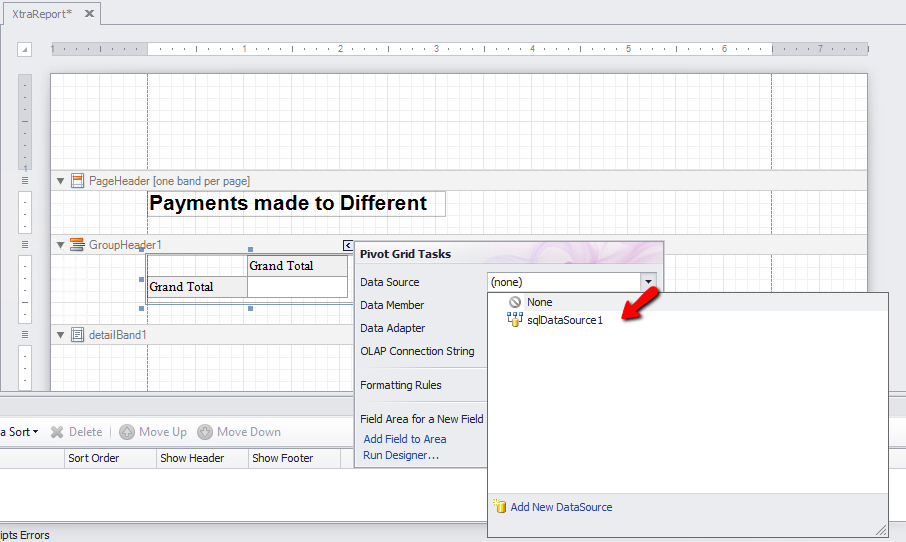
27.Click the drop down beside Data Source and select sqlDataSource1
28.Click Run Designer
 a
a