thankQ Help
Point series visualise data as a set of individual numeric data points. Line series are used to connect numeric data points by different types of line segments.
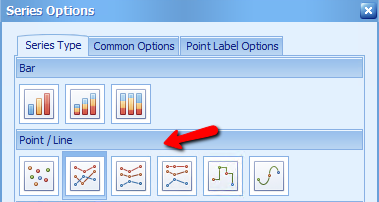
The following types of Point and Line series are available.
•Point - visualises data as a set of individual numeric data points
•Line - connects numeric data points by straight line segment
•Stacked Line - can be used to show the trend of the contribution for each value
•Full-Stacked Line - are useful for showing the trend of the percentage for each value
•Step Line - uses vertical and horizontal lines to connect the numeric data points forming a step-like progression
•Spline - plots a fitted curve through each numeric data point
1.Click on the Options button beside Amount under Values
2.Click on the different Point/Line icons to view the chart, click OK