thankQ Help
Video: https://www.youtube.com/watch?v=NR8WmjiEraE
Section |
Processed as |
Description |
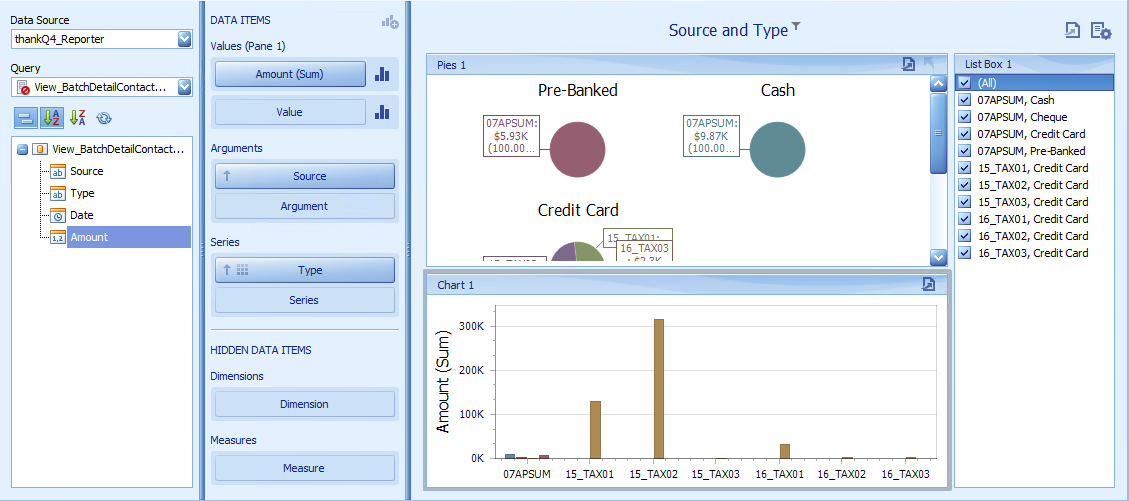
Values |
Measure |
Contains data items against which the Y-coordinates of data points are calculated. The Options button next to the Value data item allows you to select the series type and specify different options. |
Arguments |
Dimension |
Contains data items that provide values displayed along the X-axis of the chart. |
Series |
Dimension |
Contains data items whose values are used to create chart series. |
1.Locate and edit the Dashboard created above
2.Select some Parameters to work with
3.Click Chart under the Home tab on the ribbon and reposition under the Pie
4.Drag Amount to Value
5.Drag Source to Arguments
6.Drag Type to Series