thankQ Help
The main Dashboard capabilities are aggregating and summarising data obtained form the underlying data source. Dimensions and measures are key concepts used to perform these operations.
•The Dimension is used to provide discrete categorical information. These values can be of any type - string, date-time or numeric. In any case, the dashboard does not summarise the dimension values, but groups identical values. You can perform grouping, sorting, or display the top values for the dimension values.
•The Measure is used to summarise data against grouped dimension values. These values can be of any type - numeric, date-time or string. In any case, the dashboard will calculate an appropriate summary function against measure values. You can also customise the data format settings that affect how summary values are displayed.
A common term combining measures and dimensions is a data item that is an object used to bind a dashboard item to data source fields.
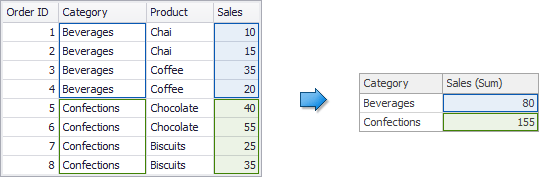
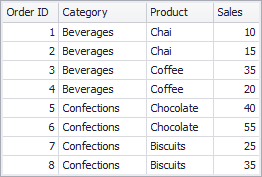
The sample underlying data source in the image below contains four fields:
Order ID, Category, Product and Sales.
If you process the Category field as a dimension and the Sales field as a measure, the Dashboard will group identical category values ('Beverages' and 'Confections' in this case) and will summarise sales values against these categories.